The Donald Lambert-created CCI indicator (oscillator) is a flexible and popular technical analysis tool that aids in spotting overbought and oversold positions, as well as trend reversals and divergences. It also aids in the execution of momentum-based trades. When trading based on momentum, much of the attention of traders is directed on companies that are making substantial swings in just one direction while experiencing high volume. Momentum traders may maintain positions for a few minutes, a few hours, or perhaps the whole trading day, depending on how rapidly the stock moves in the event of a directional shift.
Definition Of the Commodity Channel Index
The commodity channel index (CCI) is a securities oscillator that recognizes cyclical movements. It got its name from the fact that it was first used to examine commodities. While the CCI will swing above and below the zero line, it is more of a momentum indicator since its value has no upper or lower bound. The CCI indicator, like the slow stochastics and RSI, has a default duration of 14 periods. Remember that if you pick a shorter setting, the indicator's quantity of signals and sensitivity will rise.
Learn about the Commodity Channel Index (CCI)

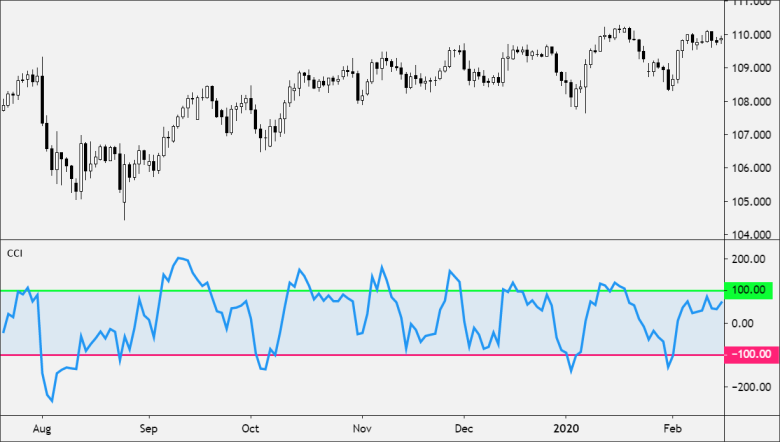
The CCI makes a comparison between the current price and the average price over a certain time period. The indicator oscillates above and below zero, entering either the positive or negative zone. About a quarter of the numbers are outside the range of -100 to +100, suggesting widespread deficits or strengths in price movements. The computation of the CCI requires 30 cycles, as seen in the preceding figure; given that the chart depicts monthly data, each subsequent calculation is based on the most recent 30 months of data. 20 and 40-cycle CCIs are also frequent.
A single period is the number of price bars that the indicator will use in its computation. The price bar might be one minute, five minutes, daily, weekly, monthly, or any other time range that the chart allows you to view. The longer the time used (, the more bars in the computation), the less likely the indicator will go beyond -100 or +100. Long-term traders and investors like larger time frames, such as 30 or 40, but short-term traders want shorter time frames since the latter delivers more indications. Short-term traders favor periods with fewer price bars in the calculation. For long-term trading, daily or weekly charts are advised. Short-term traders use indicators on charts as short as one minute, whereas long-term traders use daily charts.
CCI Strategy with Multiple Time Frames
CCI may also be used for several time periods. Long-term charts are used to identify the prevailing trend, while short-term charts are used to identify the trend's retreat and entrance points. Because "long-term" and "short-term" are connected to how long a trader intends to maintain a position, more active traders frequently utilize several time frame methods, which may even be used for day trading. When the CCI rises over +100 on your long-term chart, it signals an uptrend, but the purchase signal is only visible on the short-term chart. This trend was deemed rising until the long-term CCI dipped below -100.
Special Considerations
Charting software or a trading platform automatically calculates indicators; you simply need to specify the number of periods and chart timeframe (i.e., 4-hour, daily, weekly). When the CCI is more than +100, the price is much higher than the indicator's average price. When the indication is less than -100, the price is much lower than the average price.
The Commodity Channel Index's Limitations

While the CCI is often used to identify overbought and oversold levels, it is very subjective in this respect. Since the indicator does not have any bounds, previous levels of overbought or oversold conditions may not have much of an influence in the future. The indicator is lagging. Therefore, it may give out faulty indications sometimes. A rise to 100 or -100 to signify a new trend may be too late, as the price has already run its course and is beginning to correct.
Such occurrences are known as whipsaws; the indicator generates a signal, but the price does not follow through, resulting in a loss on the transaction. Whipsaws might happen regularly if you're not cautious. Therefore, it is advisable to utilize the indicator in combination with price analysis and other technical analysis or indicators to confirm or reject CCI indications.
Conclusion
The fact that traders have been using CCI for so long demonstrates its significance in the trading world. Unlike other oscillators, however, CCI should be used in combination with price or other indications rather than by itself. The technique does not involve a stop loss. However, it is advised that a risk limit be established to some degree.


